TABLE OF CONTENTS
- Overview
- Tracing (OpenTelemetry)
- Logging (Fluent Bit)
- Metrics (Prometheus)
- Grafana Usage Example
- Direktiv Error Handling & Logging
Overview
Direktiv observability components are embedded within the product deployment. The Direktiv observability integration depends on the availability of the logging and tracing solutions (examples are Grafana, Splunk, DataDog, Jaeger Tracing & Elastic).
Observability within Direktiv implies the following:
- Have metrics available from the Direktiv engine and software components, as well as the containers run during a workflow execution.
- Log files needed to be collected from the Direktiv engine, the Knative function call, the API calls, the containers at runtime and the workflows
- Telemetry information from all of the components above.
The diagram below illustrates the high-level integration between the components and standards:
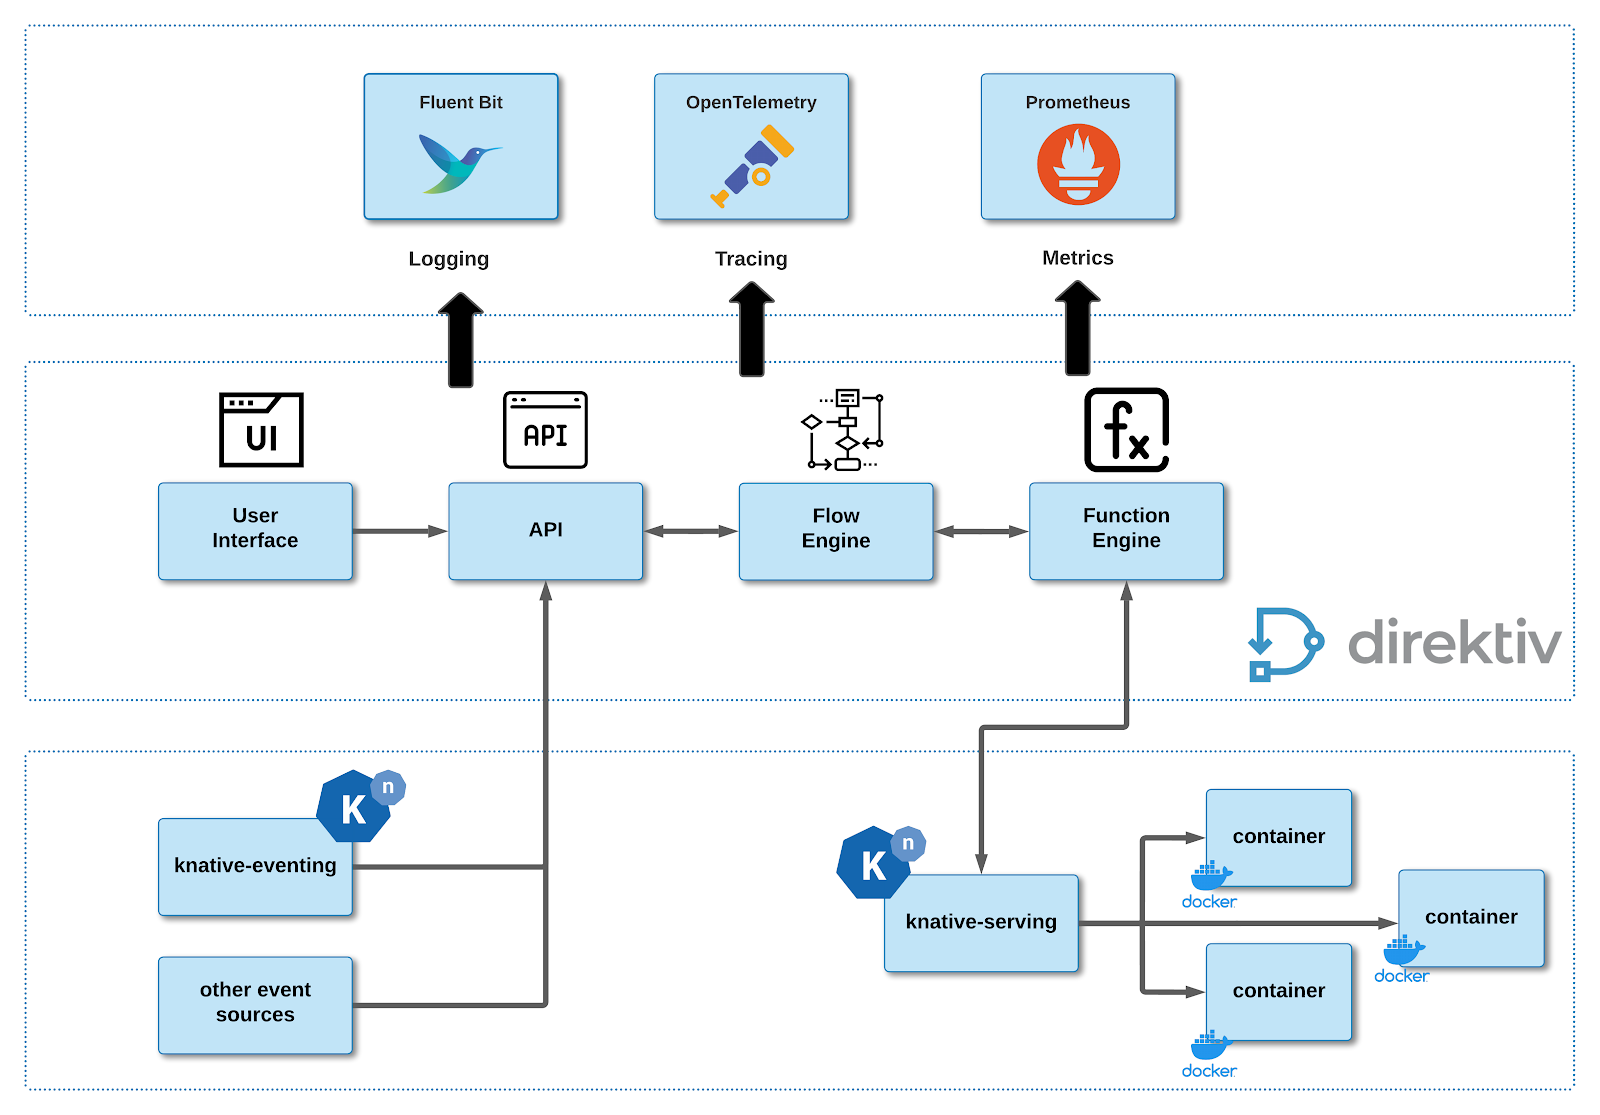
Observability component integration
For the purposed of this guide, it is assumed that Grafana Labs components are used (i.e. Grafana Dashboard, Loki, Tempo and Prometheus).
Direktiv Configuration Files
Direktiv can be configured during the install to send metrics, logs and tracing information to any OpenTelemetry, Fluent Bit or Prometheus enabled system. The direktiv.yaml is a file which contains configuration and installation options. A sample file can be seen here. Each of the components are discussed in more detail below.
Tracing (OpenTelemetry)
During the installation of the Direktiv Enterprise Edition a file was created in the following directory structure:
ubuntu:~/direktiv/install/04_direktiv$ ls -la
total 20
drwxr-xr-x  2 ubuntu ubuntu 4096 Oct 31 16:43 .
drwxr-xr-x 11 ubuntu ubuntu 4096 Oct 31 17:02 ..
-rw-r-xr-x  1 ubuntu ubuntu  827 Sep  1 00:11 direktiv_dev.yaml
-rw-r-xr-x  1 ubuntu ubuntu 2304 Oct 31 16:43 direktiv_prod.yaml
-rwxr-xr-x  1 ubuntu ubuntu  137 Sep  1 00:11 install.sh
ubuntu:~/direktiv/install/04_direktiv$
NOTE: the installation of the OpenSource edition requires the user to create the file manually as it is installed with default configurations and limited capabilities
Applying the OpenTelemetry configuration requires the following:
- Edit the direktiv_prod.yaml file (or if the direktiv_dev.yaml file was used)
- Add the following YAML configuration to the file where:
- endpoint: the OpenTelemetry receiving endpoint is “<hostname|ip>:<grpc-port>”
# Added this to connect to tracing.direktiv.io
opentelemetry:
  # -- installs opentelemtry agent as sidecar in flow
  enabled: true
  # -- config for sidecar agent
  # 4317 PORT
  agentconfig: |
    receivers:
      otlp:
        protocols:
          grpc:
          http:
    exporters:
      otlp:
        endpoint: "tracing.direktiv.io:30984" # grpc port
        insecure: true
        sending_queue:
          num_consumers: 4
          queue_size: 100
        retry_on_failure:
          enabled: true
      logging:
        loglevel: debug
    processors:
      batch:
      memory_limiter:
        # Same as --mem-ballast-size-mib CLI argument
        ballast_size_mib: 165
        # 80% of maximum memory up to 2G
        limit_mib: 400
        # 25% of limit up to 2G
        spike_limit_mib: 100
        check_interval: 5s
    extensions:
      zpages: {}
    service:
      extensions: [zpages]
      pipelines:
        traces:
          receivers: [otlp]
          processors: [memory_limiter, batch]
exporters: [logging, otlp]- Run the following command to enable it:
helm upgrade -f direktiv.yaml direktiv direktiv/direktiv
- In some cases it might be required to restart the following kubernetes pods using the $ kubectl delete pods <pod-name>:
# kubectl get pods
default            direktiv-api-5874c859d4-sdvqp                            2/2     Running     2 (30m ago)   30m
default            direktiv-flow-b9556b44f-65nmv                            3/3     Running     0             30m
default            direktiv-functions-5c4896cdcc-6phsz                      2/2     Running     0             30m
default            direktiv-prometheus-server-667b8c6d65-bsn44              3/3     Running     0             30m
default            direktiv-ui-549b6bdddf-znbhp                             2/2     Running     0             30m
No other configuration or installation is needed. Direktiv will now send all OpenTelemetry information to the destination defined in the endpoint configuration.
Logging (Fluent Bit)
Fluent Bit is more complicated to install and configure. Direktiv has a default Fluent Bit configuration which generally would not need to be modified. This is shown below:
fluentbit:
  # -- postgres for direktiv services
  # Append extra output to fluentbit configuration.
  # There are two log types: application (system), functions (workflows)
  # these can be matched to new outputs.
  extraConfig: ""
  # extraConfig: |
  #   [OUTPUT]
  #           name stdout
  #           match application
Since Fluent Bit is used by several other components in the Kubernetes cluster, it’s installed separately using a helm chart. The following steps installs and configures the Fluent Bit adapter for export to (as an example) a Loki instance:
- Create a fluentbit.yamlfile with the following configuration:
- host: the IP address or hostname of the Fluent Bit receiver
- port: port on which the receiver is listening
- http_user: username for authentication to the receiver
- http_passwd: password for authentication to the receiver
logLevel: debug
config:
  inputs: |
    [INPUT]
        Name tail
        Path /var/log/containers/direktiv-api*api*.log,/var/log/containers/direktiv-flow*flow*.log,/var/log/containers/direktiv-functions*functions*.log
        multiline.parser docker, cri
        Tag kube.*
        Mem_Buf_Limit 5MB
        Skip_Long_Lines On
  outputs: |
    [OUTPUT]
        Name stdout
    [OUTPUT]
        name   loki
        match  *
        host  tracing.direktiv.io
        port  31038
        http_user   admin
        http_passwd gKHdNko3jNWpadVQhjxsZQaE6WVozFoOYxNZLSlh
labels component=$component,trace=$trace,namespace=$namespace,workflow=$workflow,instance=$instance- Run the following command to add Fluent Bit to the helm repository:
helm repo add fluent https://fluent.github.io/helm-charts
- Run the following command to install Fluent Bit with the configuration created above:
helm install -f fluentbit.yaml fluent-bit fluent/fluent-bit
No other configuration or installation is needed. Direktiv will now send all Logging information to the destination defined in the configuration.
NOTE: there are some additional options that can be applied to Fluent Bit configuration. An example file is shown below which will also send NGINX and Kubernetes logging information:
config:
  inputs: |
    [INPUT]
        Name http
        Tag nginx.*
        host 0.0.0.0
        port 8080
    [INPUT]
        Name tail
        Path /var/log/containers/direktiv-api*api*.log,/var/log/containers/direktiv-flow*flow*.log,/var/log/containers/direktiv-functions*functions*.log
        multiline.parser docker, cri
        Tag kube.*
        Mem_Buf_Limit 5MB
        Skip_Long_Lines On
  outputs: |
    [OUTPUT]
        Name stdout
    [OUTPUT]
        name   loki
        match  nginx.*
        host  loki.loki
        labels component=$component,trace=$trace,user=$user,name=$name,url=$url,email=$email,method=$method
    [OUTPUT]
        name   loki
        match  kube.*
        host  loki.loki
        labels component=$component,trace=$trace,namespace=$namespace,workflow=$workflow,instance=$instance,variable=$variable,secret=$secret,service=$service,servicerevision=$servicerevision,pod=$pod,pathoperation=$pathoperation,routename=$routename,httpmethod=$httpmethod,httppath=$httppath
  filters: |
    [FILTER]
        Name kubernetes
        Match kube.*
        Merge_Log On
        Keep_Log Off
        K8S-Logging.Parser On
        K8S-Logging.Exclude On
    [FILTER]
        Name stdout
        Match nginx.*
extraPorts:
- port: 8080
  containerPort: 8080
  protocol: TCP
  name: input
Metrics (Prometheus)
For Prometheus, Direktiv already has a running instance which is used for user interface metrics. The configuration below simply adds additional metrics to send to this instance.
When using Grafana, you configure the Prometheus data source to point to the cluster IP address of the Direktiv server to retrieve these statistics. An example Prometheus configuration file is shown below and is added to the direktiv.yaml configuration file during the installation process.
prometheus:
  install: true
  backendName: "prom-backend-server" # required if install = false
  global:
    scrape_interval: 1m
    evaluation_interval: 1m
  server:
    retention: 96h
    persistentVolume:
      enabled: false
  alertmanager:
    enabled: false
  nodeExporter:
    enabled: false
  pushgateway:
    enabled: false
  kubeStateMetrics:
    enabled: false
  serviceAccounts:
    alertmanager:
      create: false
    nodeExporter:
      create: false
    pushgateway:
      create: false
    server:
      create: true
Grafana Usage Example
Using an installed instance of Grafana (Tempo, Loki, Prometheus), you can add the sources for each of the components in the dashboard.

Grafana data sources for Loki, Prometheus and Tempo
Running a simple workflow to generate some logs and tracing information:

The highlighted id db2cb752-8108-482c-a94e-d04a5b9f80c0 (in red) is the workflow execution id. This is going to be used when querying for the logs in Grafana Loki.
As can be seen in the Direktiv console, the output for the workflow as well as any container generated logs are displayed during runtime.
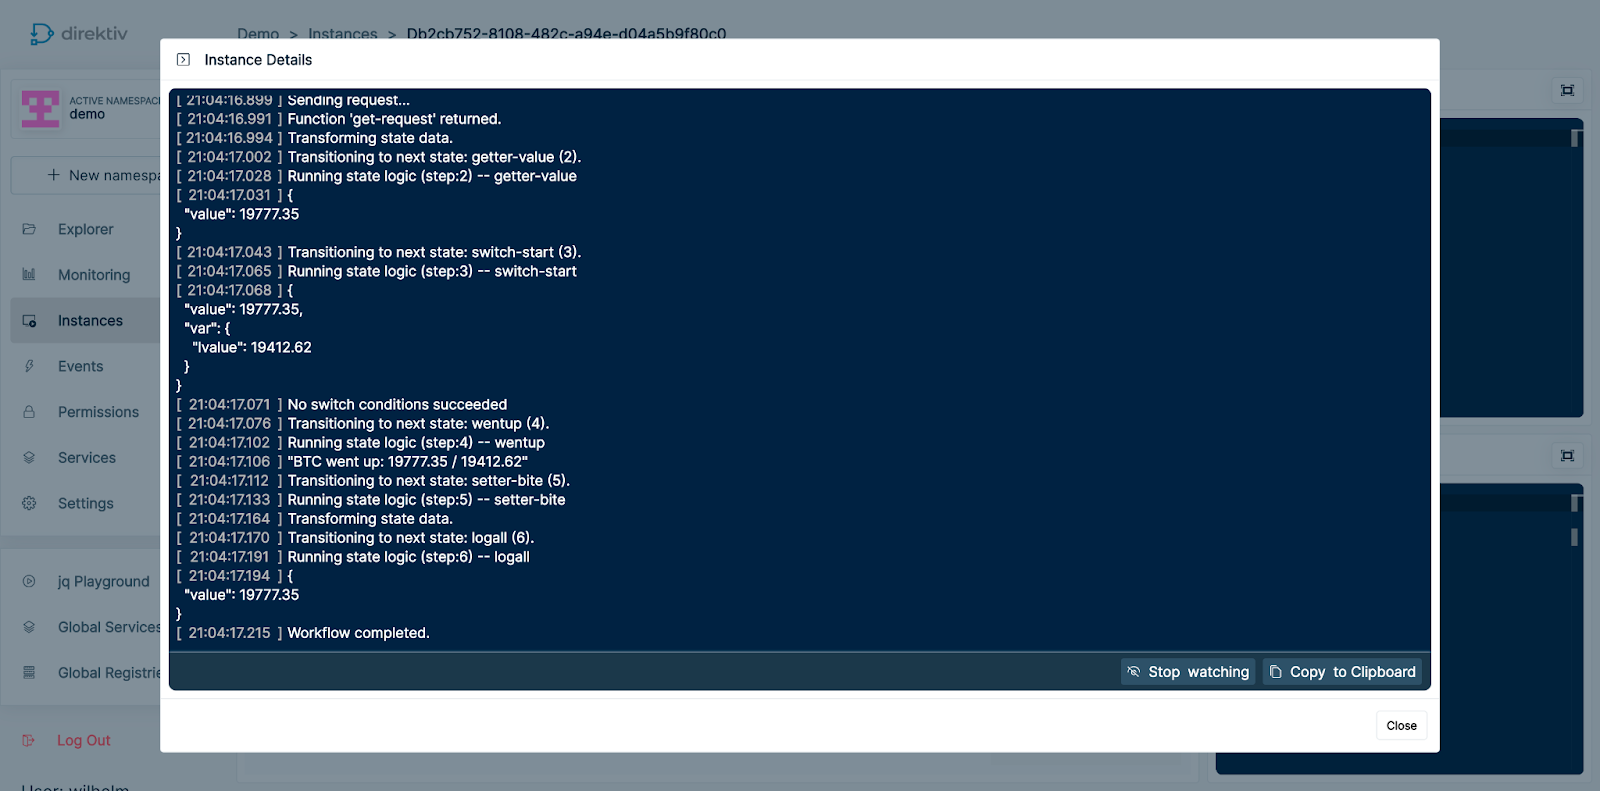
Direktiv workflow logs in the console
Within the Grafana Loki interface:
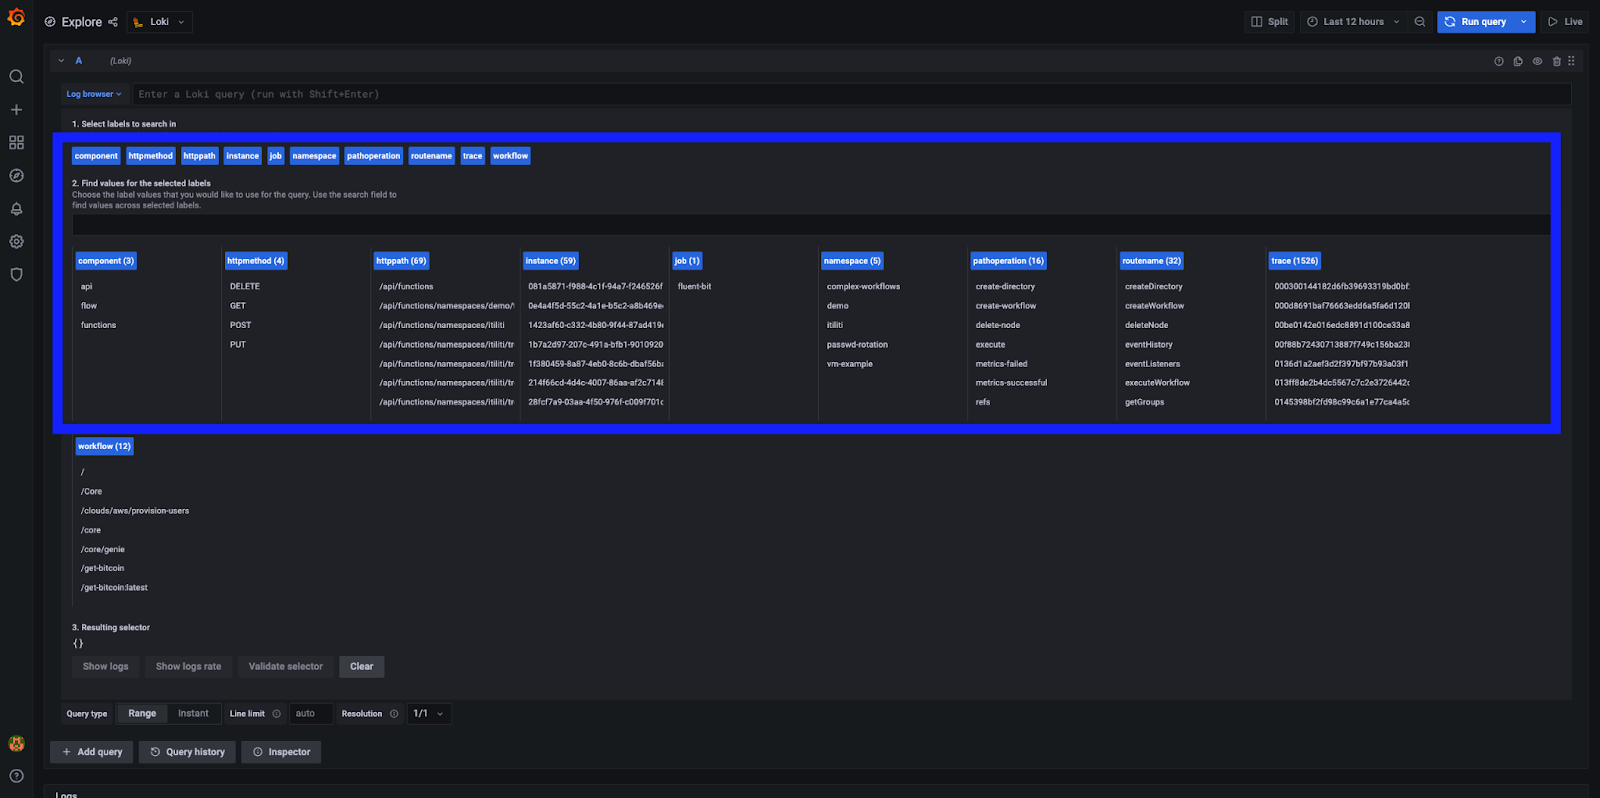
Grafana Loki log browser options
The Log Browser option labels gives us a little insight into everything we’re logging with Direktiv. The labels that I normally focus on are:
- component: includes logs for any api calls, flow log files (the workflow log files) and functions (the handling of the container execution)
- instance: this refers to the instance id we previously matched with the workflow instance we executed, so narrows it down to only a specific instance
- workflow: displays all log files for a specific workflow (but includes all instances within the selected time range)
Of course there are a lot more to look at … but way beyond the scope of this article. Now let’s have a look at the specific workflow instance id {instance="db2cb752-8108-482c-a94e-d04a5b9f80c0"} and only focussing on the workflow log files {component="flow"}.

Specific instance workflow log files with traceid
The msg field contains the log files printed to the Direktiv console, while highlighted in red is the tracing id (trace), which we can use with Tempo!
Using the trace id in Tempo, we can see the start-to-finish tracing information for the workflow and all of the underlying components (API calls, container calls, and workflow calls) in the timeline diagram.

Trace information for the workflow instance execution
Drilling down into each of the steps gives you a LOT more information:

Almost all of the critical logging is already in place when you install Direktiv. A user can add their own custom container log files as well. This is discussed in the next section.
Direktiv Error Handling & Logging
Internally to Direktiv we refer to the containers as “functions” due to the nature of how their usage is declared in the configuration file:
functions:
- id: aws-cli
  image: gcr.io/direktiv/functions/aws-cli:1.0
  type: knative-workflow
This is the definition for running the gcr.io/direktiv/functions/aws-cli container. Now, let’s look at how Direktiv handles logging & error handling for custom functions (i.e. containers). Refer to the diagram below for the next couple of sub-sections.

Data Input & Output
This has been covered a couple of times, but Direktiv passes JSON data between the container and the Direktiv Functions component as the workflow executes. The JSON data by default is transported over HTTP on port 8080 (unless it’s configured with SSL). More importantly, a Direktiv-ActionID header is set. This header is used for communication between the Direktiv Function and the container and isolates the data being passed for the workflow.
Reporting Errors
If something goes wrong a function (container) can report an error to the workflow instance by adding HTTP headers to the response. If these headers are populated the execution of the function will be considered a failure (regardless of what’s stored in response data).
The headers to report errors are: Direktiv-ErrorCode and Direktiv-ErrorMessage. If an error message is defined without defining an error code the calling workflow instance will be marked as “crashed” without exposing any helpful information, so it’s important to always define both. As an example, the following error headers are defined:
"Direktiv-ErrorCode": "request.failure",
"Direktiv-ErrorMessage": "Failed to complete request"
Errors raised by functions are always ‘catchable’ by their error codes in the workflow configuration (see below):
- id: get-bitcoin-price
  type: action
  action:
    function: get-request
    input:
      method: "GET"
      url: "https://blockchain.info/ticker"
  catch:
    - error: "request.*"
Function Logs
Logging for functions is a simple HTTP POST to the address:
http://localhost:8889/log?aid=$ACTIONID
The content of the body of the request is logged . The important parameter is again $ACTIONID (which is the Direktiv-ActionID).
As explained earlier, every request gets a Direktiv-ActionID which identifies the workflow instance. This parameter has to be passed back to attach the log to the instance. This information is passed in as in the initial request (Direktiv-ActionID).
Sample Python (logging & errors)
Below is an example of how a Python custom implementation would look for logging and error management between code, container and Direktiv (more examples are available here):
from http.server import BaseHTTPRequestHandler, HTTPServer
import requests
import json
import signal
import sys

PORT = 8080

# Headers
DirektivActionIDHeader     = "Direktiv-ActionID"
DirektivErrorCodeHeader    = "Direktiv-ErrorCode"
DirektivErrorMessageHeader = "Direktiv-ErrorMessage"

InputNameField = "name"

class DirektivHandler(BaseHTTPRequestHandler):
    def _log(self, actionID, msg):
        if actionID != "development" and actionID != "Development":
            try:
                r = requests.post("http://localhost:8889/log?aid=%s" % actionID, headers={"Content-type": "plain/text"}, data = msg)
                if r.status_code != 200:
                    self._send_error("com.greeting-bad-log.error", "log request failed to direktiv")
            except:
                self._send_error("com.greeting-bad-log.error", "failed to log to direktiv")
        else:
            print(msg)

    def _send_error(self, errorCode, errorMsg):
        self.send_response(400)
        self.send_header('Content-type', 'application/json')
        self.send_header(DirektivErrorCodeHeader, 'application/json')
        self.send_header(DirektivErrorMessageHeader, errorMsg)
        self.end_headers()
        self.wfile.write(json.dumps({"error": errorMsg}).encode())
        return

    def do_POST(self):
        actionID = ""
        if DirektivActionIDHeader in self.headers:
            actionID = self.headers[DirektivActionIDHeader]
        else:
            return self._send_error("com.greeting-bad-header.error", "Header '%s' must be set" % DirektivActionIDHeader)

        self._log(actionID, "Decoding Input")
        self.data_string = self.rfile.read(int(self.headers['Content-Length']))
        reqData = json.loads(self.data_string)

        if InputNameField in reqData:
            self.send_response(200)
            self.send_header('Content-type', 'application/json')
            self.end_headers()

            # Respond Data
            self._log(actionID, "Writing Output")
            self.wfile.write(json.dumps({"greeting": "Welcome to Direktiv, %s" % reqData[InputNameField]}).encode())
            return
        else:
            return self._send_error("com.greeting-input.error","json field '%s' must be set" % InputNameField)


httpd = HTTPServer(('', PORT), DirektivHandler)
print('Starting greeter server on ":%s"' % PORT)

def shutdown(*args):
    print('Shutting down Server')
    httpd.server_close()
    sys.exit(0)

signal.signal(signal.SIGTERM, shutdown)
httpd.serve_forever()
Was this article helpful?
That’s Great!
Thank you for your feedback
Sorry! We couldn't be helpful
Thank you for your feedback
Feedback sent
We appreciate your effort and will try to fix the article